
I tried my best not to come up with such a click-bait-y title for this post. However, Mr. Neyman (1894-1981) and Mr. Pearson (1895-1980) didn’t leave much room for that.
This is Part-1 of this two-part post. I have built an interactive Shiny app in R for visualizing what goes under the hood of these hypothesis tests. That can be found in Part-2.
First, let me define the “power” of a hypothesis test. In terms of statistics, Power is the probability of rejecting a null hypothesis when it is actually false. In layman terms, let us say we have a testing protocol which decides over two possible outcome: A and B. In this case, we have four possible scenario:
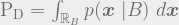
![\mathrm{P_D} = \mathrm{Pr}[ \ decide \ for \ B \ | \ B \ \mathrm{true}]](https://s0.wp.com/latex.php?latex=%5Cmathrm%7BP_D%7D+%3D+%5Cmathrm%7BPr%7D%5B+%5C+decide+%5C+for+%5C+B+%5C+%7C+%5C+B+%5C+%5Cmathrm%7Btrue%7D%5D++&bg=eeeeee&fg=666666&s=1&c=20201002)
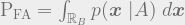
![\mathrm{P_{FA}} = \mathrm{Pr}[ \ decide \ for \ B \ | \ A \ \mathrm{true}]](https://s0.wp.com/latex.php?latex=%5Cmathrm%7BP_%7BFA%7D%7D+%3D+%5Cmathrm%7BPr%7D%5B+%5C+decide+%5C+for+%5C+B+%5C+%7C+%5C+A+%5C+%5Cmathrm%7Btrue%7D%5D+&bg=eeeeee&fg=666666&s=1&c=20201002)
![\mathrm{P_M} = \mathrm{Pr}[ \ decide \ for \ A \ | \ B \ \mathrm{true}]](https://s0.wp.com/latex.php?latex=%5Cmathrm%7BP_M%7D+%3D+%5Cmathrm%7BPr%7D%5B+%5C+decide+%5C+for+%5C+A+%5C+%7C+%5C+B+%5C+%5Cmathrm%7Btrue%7D%5D+&bg=eeeeee&fg=666666&s=1&c=20201002)
If you have a close look, the last two scenarios represent error of two kinds. Historically, these are known as Type-1 and Type-2 error. However, I find these nomenclatures extremely non-intuitive. To make the entire topic a little more intuitive, let us use an example. Let us say, we are trying to detect the presence of a signal in a radar output in Gaussian noise. Outcome A indicates the absence of signal, which means the output contains noise only. Outcome B indicates the presence of signal in Gaussian noise. Clearly, Type-1 error means a false alarm whereas Type-2 error means a miss detection. In above equations, 


![1-\mathrm{P_{FA}} = \mathrm{Pr}[ \ decide \ for \ A \ | \ A \ \mathrm{true}]](https://s0.wp.com/latex.php?latex=1-%5Cmathrm%7BP_%7BFA%7D%7D+%3D+%5Cmathrm%7BPr%7D%5B+%5C+decide+%5C+for+%5C+A+%5C+%7C+%5C+A+%5C+%5Cmathrm%7Btrue%7D%5D+&bg=eeeeee&fg=666666&s=1&c=20201002)
Also, the detection and miss detection probabilities are connected via

We have set our conceptual backdrop. Now we want to make this test the most powerful. This means: we want to come up with a decision rule that maximizes
We need to answer this question first. Let us say, the decision rule divides the entire field (over which the likelihood functions are defined) into two disjoint region 


Here 


What is Neyman-Pearson Criterion?
The Neyman-Pearson criterion see that problem in a rather different light. It asks, how can we maximize

It can be solved using Lagrange multiplier. I will take a rather different path by solving it graphically because that is more insighful. For that, let us consider a simple yet common case. Each likelyhood function under different hypothesis are Gaussian, differing only by mean but they share the same covariance matrix.


where 


Taking the log-likelihood ratio of above likelihood functions and simplifying further (which is really straightforward), we end up with the following expression

Now, the log-likelihood ratio test can be written as following by rearranging the above a little
Decide for A if 
Decide for B if 
In fact, the likelihood ratio test can be further simplified by a introducing the notion of “Sufficient Statistic”.
An extremely small primer to Sufficient Statistic:
Sufficient Statistic is a particular statistic or algebraic manipulation of our observation
Decide for A if

Decide for B if 
It is clear that, the term 


Decide for A if

Decide for B if
For this example, the sufficient statistic 


In the next part, we will be looking for the optimum decision rule and develop the tools to evaluate the performance of our tests.
(The comic in the featured image is stolen from the amazing xkcd)

One thought on “Build the most powerful hypothesis test: Part 1”